Key Points
- Easily digest current system operational state through visualising the system as a 2D map
- Isolate zones on the map that represent faulty operation for simple condition monitoring and fault detection
- Identify unexpected and potentially fault driven novel operation detected by a poor fit to the map
Self Organising Maps
What if a data science system could be developed that automatically assesses plant behaviour to provide an accurate and refined description of current operation? Such a system would allow, at a glance, operators to digest recent sensor data and get an instant update on current operating condition. It would also provide a simultaneous view of surrounding operating states which can guide operators in optimising performance by moving the plant from an unhealthy condition, towards a healthy condition. AI can help industrial system operators achieve this.
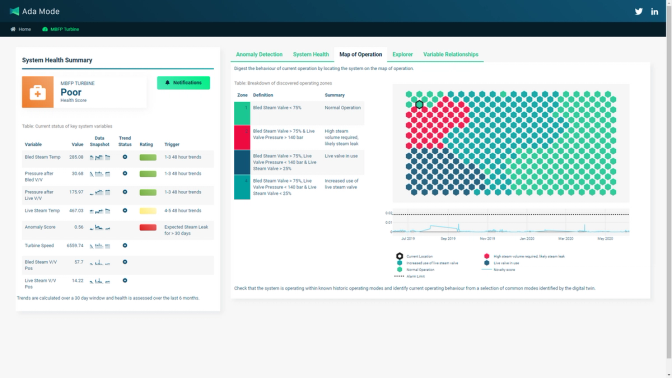
Specialist unsupervised neural network models (self-organising-maps) can produce a map of system operational space. By locating where current operation is placed on the map, it is possible to accurately classify current operating modes and identify nearby similar states or assess the proximity to potential adverse operating regions.

The neural network produces a coordinate grid, each period of historic operation is assigned to a coordinate on the grid. Neighbouring coordinates represent similar operating modes. Expanding on this, the map can be segmented into regions by applying clustering algorithms to the map weights. Checking and inferring the meaning of these clusters leads to the generation of operating mode descriptions using decision trees, other inference methods and domain knowledge to form the descriptions.
Any periods of operation which are distant from all known regions of the map may represent a new operating mode or, more likely, a period of anomalous behaviour which can be flagged to system owners for remedial action. Subtle anomalous behaviour can be detected which may be missed without the automated data review carried out by the map-network.
Applications to a steam turbine and biogas digester
Ada Mode have applied this methodology to two industrial systems both of which were known to have failure events or prolonged spells of sub-optimal operation. In both cases a trained system map powered by AI was able to place this unhealthy operation on the map, and hence detect any operation that ventured into these high-risk locations.
In production the mapping and clustering systems combined can provide live map location updates and alert when within or nearby the adverse operating mode. It is likely that any new adverse conditions will also be detected due to the algorithms ability to check the distance from the known map. A large distance greater than a selected threshold is likely to belong to a new operating mode.
Here we present a video of another self-organising-map in action. This time mapping the various operating modes of a biogas digester tank including the occurrence of a costly failure event known as foaming.
The demo highlights current operating modes, the distance to the map against the expected threshold, and descriptions of each operating mode identified by the clustering algorithm.
In this sped-up simulation over historic data you can see how the map indicates the movement between states. This includes when entering areas that have a significant relationship with problematic foaming events or those relating to inefficient operation caused by reduced output gas-flow. All this information can be gained from a single glance at the map.
Integrating with existing CMS
Ada Mode’s condition monitoring tool set contains a variety of methods and techniques all designed to guard against system failure. We see system mapping enabled by self-organising-maps as a key part of the machine and compliments our other technology.
The anomaly detection and degradation-based condition monitoring approaches implemented by Ada Mode mesh well with the SOM, providing a comprehensive tool-kit for advanced condition monitoring. The latent space learnt by an autoencoder, used for our core anomaly detection offering and can be found powering our anomaly detection tool, can be extracted and used as the map input. This hybridisation allows the map to capture more complex operating modes and patterns understood by the autoencoder.
System forecasts, used for regression-based anomaly detection and short-term planning, can be given straight to the map giving insight into expected system trajectories and potential future destinations.
Final Thoughts
Self-organising-maps can be a powerful tool in any condition monitoring system. The unsupervised neural network algorithm in combination with other unsupervised machine learning approaches can learn to identify key operating modes and enable effective and efficient communication of system condition at any given moment.


